Getting Started
Each section in Getting Started will have an overview of what you will learn and then give step-by step instructions. We encourage you to follow the sections in order if this is your first time exploring the help guides.
What you will learn:
- How to sign in and navigate your dashboard or team view in Visualization Community (VisCom).
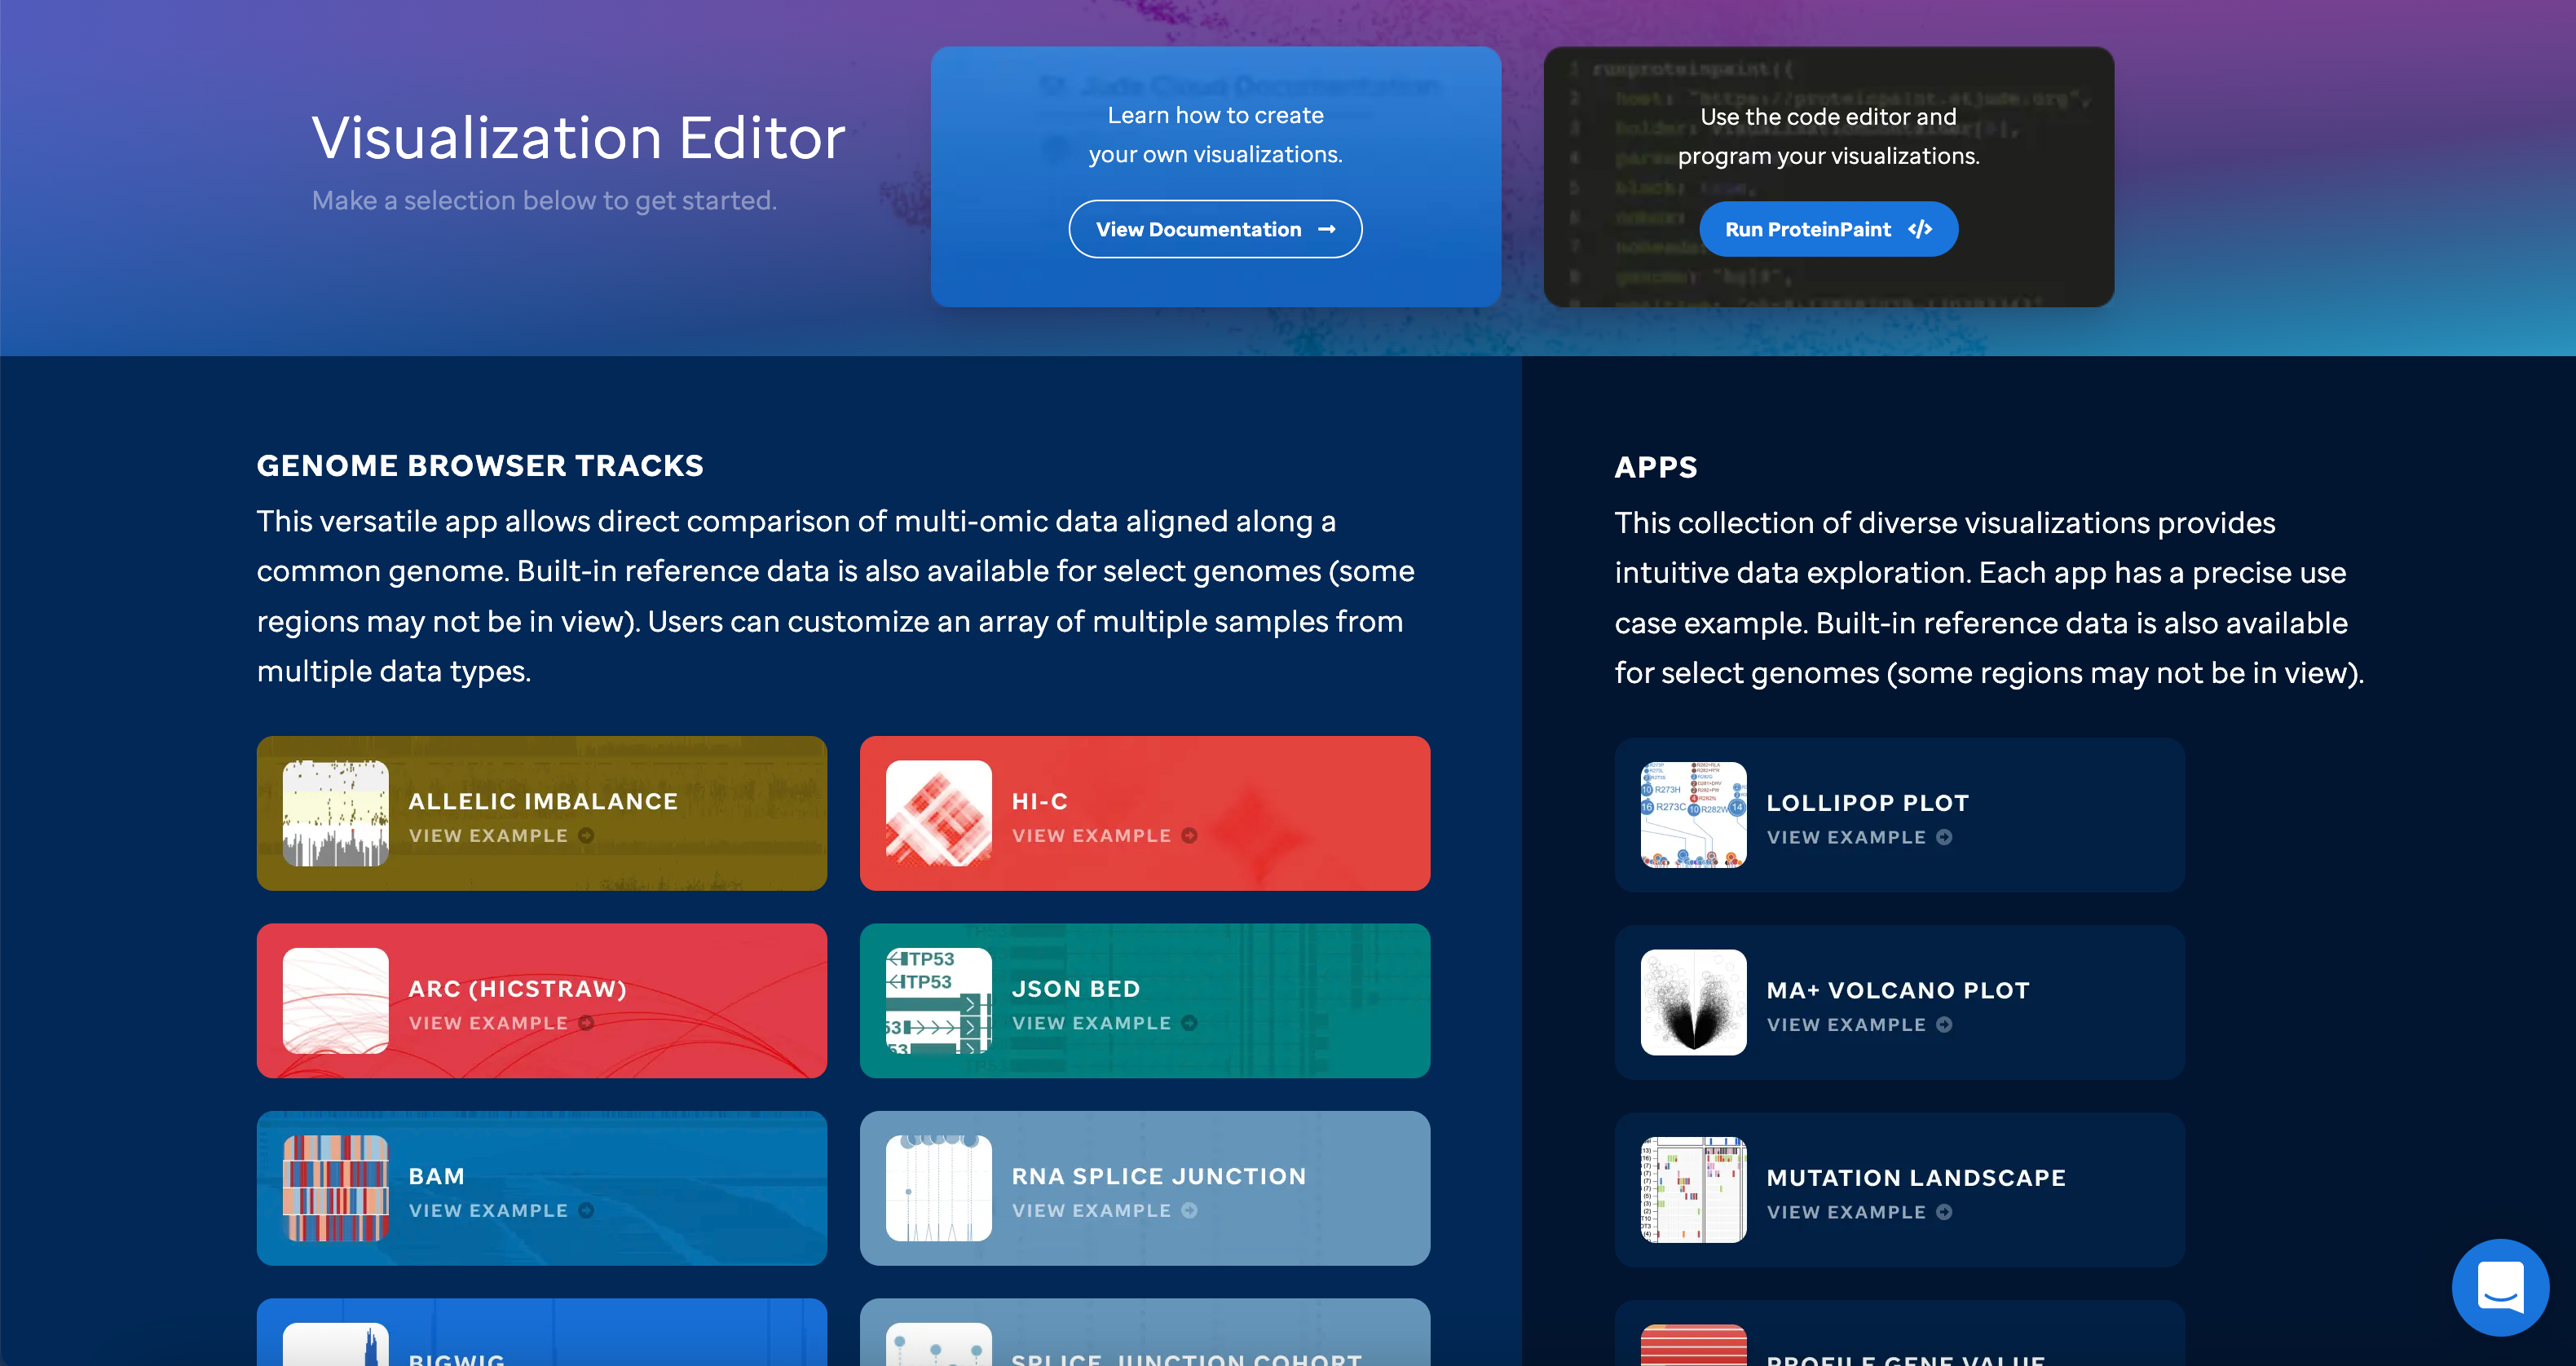
- How to use the new visualization editor.
- How to manage your data.
- How to reference the code block library for the VisCom editor.
- How to create a collection or community.
- How to make a public vs private visualization.
- How to embed your visualizations.
Examples of curated visualizations can be found in VisCom. This internal setting is enabled to show the code block that can be used to copy/paste into our new Visualization Editor. Additionally, if you explore our new Easy Editor View, you can access each example immediately by selecting your choice of track or app and having it prefilled with curated data.
For additional learning about ProteinPaint please go to the ProteinPaint Google Docs.
If you have any questions, please reach out to support@stjude.cloud or if you need to cite St. Jude Cloud, please follow this link.
Check out our videos!
A video series covering each section can be found here.
Frequently Asked Questions
KeyWord(s): VisCom (Visualization Community)
How to get sign-up, sign-in, and navigate to your dashboard or teams view
In this section, you will learn how to sign-up and/or sign-in so that you can create visualizations within an account. Once you are in, you can navigate to your own dashboard or teams view to start creating visualizations.