Filtering Mutations
Filtering mutations based on class and origin
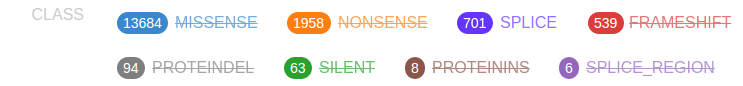
ProteinPaint uses the color of the discs to represent the mutation classes, as indicated in the legend:
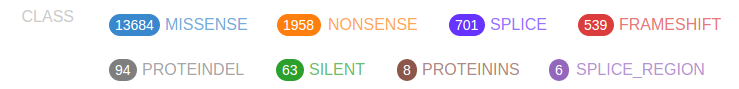
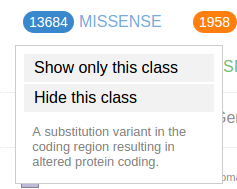
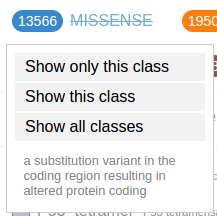
The numbers in the legend indicate the total number of mutations currently shown for each class. Clicking on a class shows a menu:
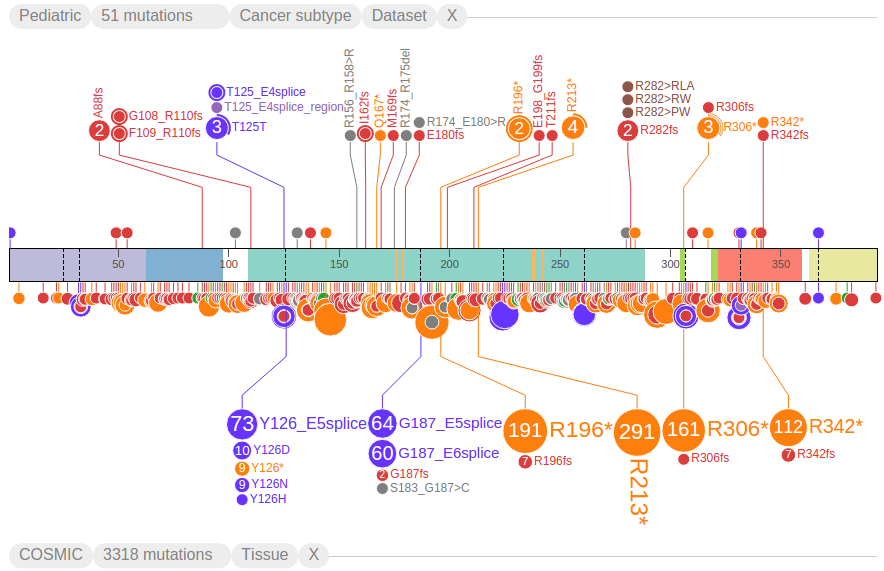
Use the options in the menu to show/hide mutations from a selected class. The following screenshot shows the view after hiding all missense mutations, making nonsense mutations (orange) the most abundant class. There is also a strikethrough to the MISSENSE class label in legend, indicating it is hidden

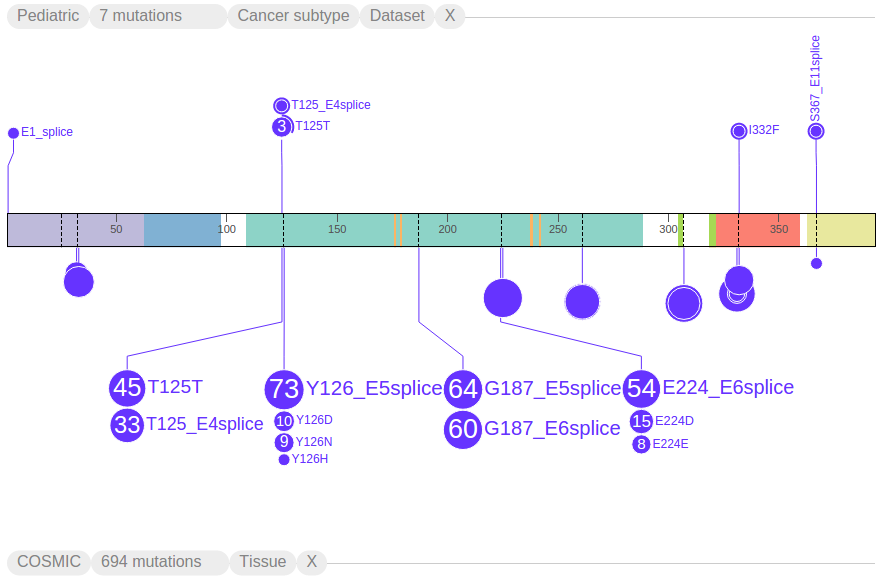
As another example, the following shows only splice site mutations, with strikethroughs in all the other class labels in the legend:
To restore mutations for of all classes, click on any mutation class button then select "Show all classes":
In the Pediatric data set, germline and relapse mutations are also denoted in the "Origin" section of the legend:

Click on an origin type to see a menu similar to the mutation class menu:
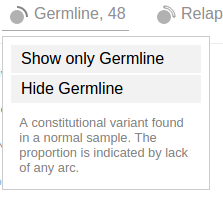
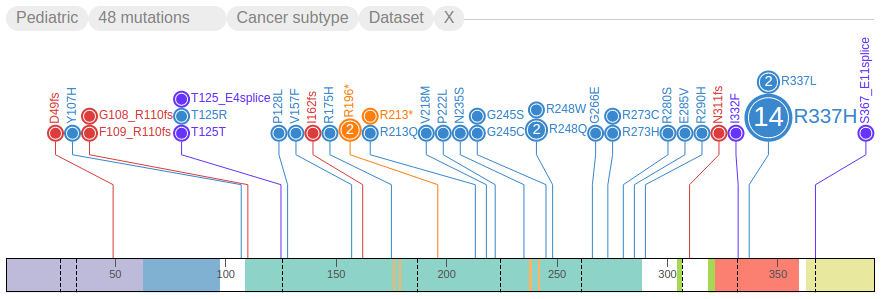
Using these options, only germline mutations are shown as below:
Viewing Expression Data
Gene expression data by RNA-Seq is available for close to 1000 pediatric cancer samples. This data set is made available on ProteinPaint in the form of gene-level FPKM values, so that while browsing the Pediatric mutations in genes of interest, the user may view gene expression levels in the same cohort.
Exporting Figures and Data
User can export figure or data for the current view on ProteinPaint. Mouse over the "More" link following the data set handles for a menu, then click "Export SVG" to download an SVG file as the screenshot of current view, like the example below: