Using Disease Pie Charts
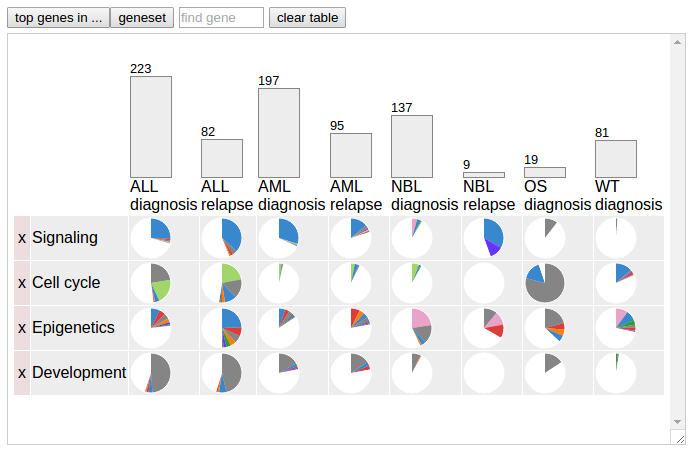
When the uploaded data set stratify samples based on disease categories, pie charts can be made to visualize mutation to a gene or gene set in each disease category.
When the uploaded data set stratify samples based on disease categories, pie charts can be made to visualize mutation to a gene or gene set in each disease category.
to be finished ...
Using the Heatmap
Heatmap is a gene-by-sample grid representing mutations from a data set, looking like below:
Stratifying Mutations by Cancer Subtype
In the header of the Pediatric data set graph, click on the third button labeled "Cancer subtype" to show a menu listing number of mutations in each cancer type and subtype: