Visualizing NGS Data
In the future, we will release an alpha version of the GenomePaint visualization tool on St. Jude Cloud. In the meantime, the best way to visualize NGS data on St. Jude Cloud is using IGV. You can use the desktop or web browser versions of IGV.
Desktop IGV
DNAnexus has an existing guide on viewing files in DNAnexus using the desktop version of IGV. You can view the guide here.
Web Browser IGV
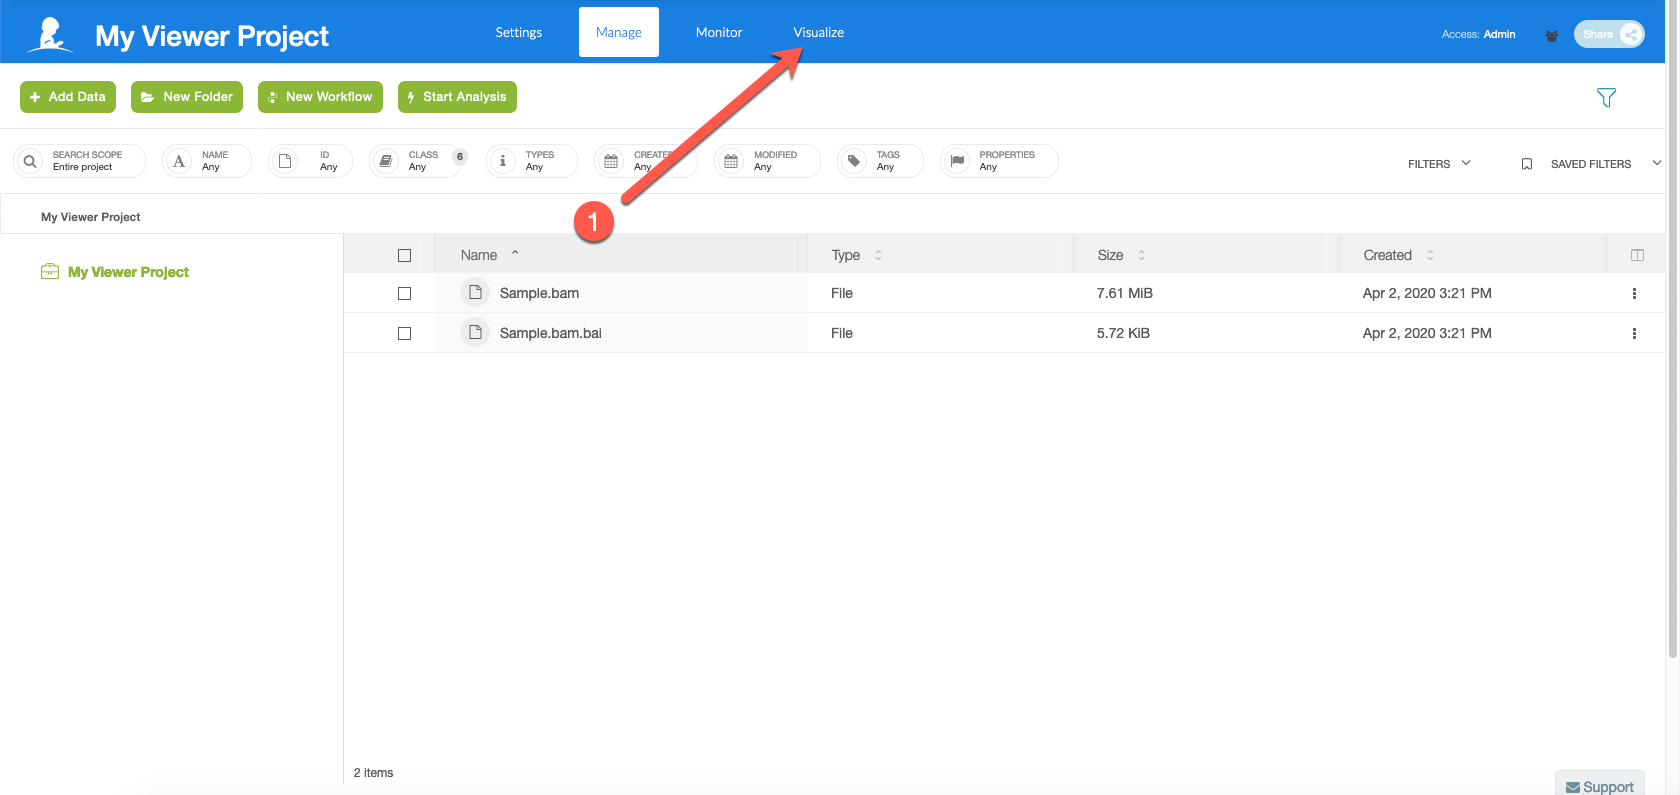
Within any DNAnexus project, you can view the data in the IGV web browser by doing the following steps.
Select "Visualize"
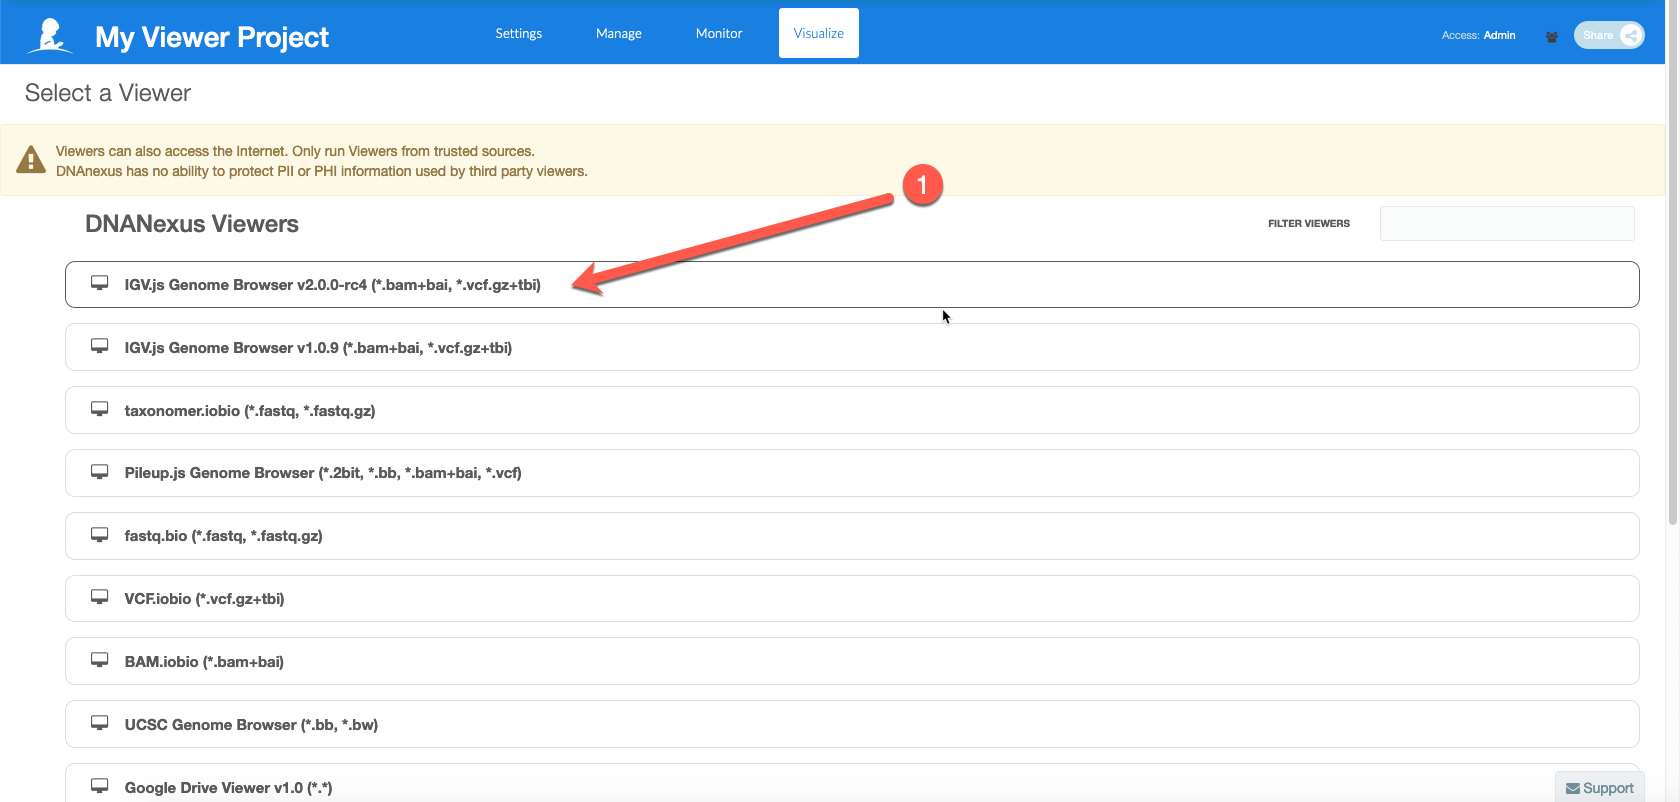
Select IGV v2.0.0
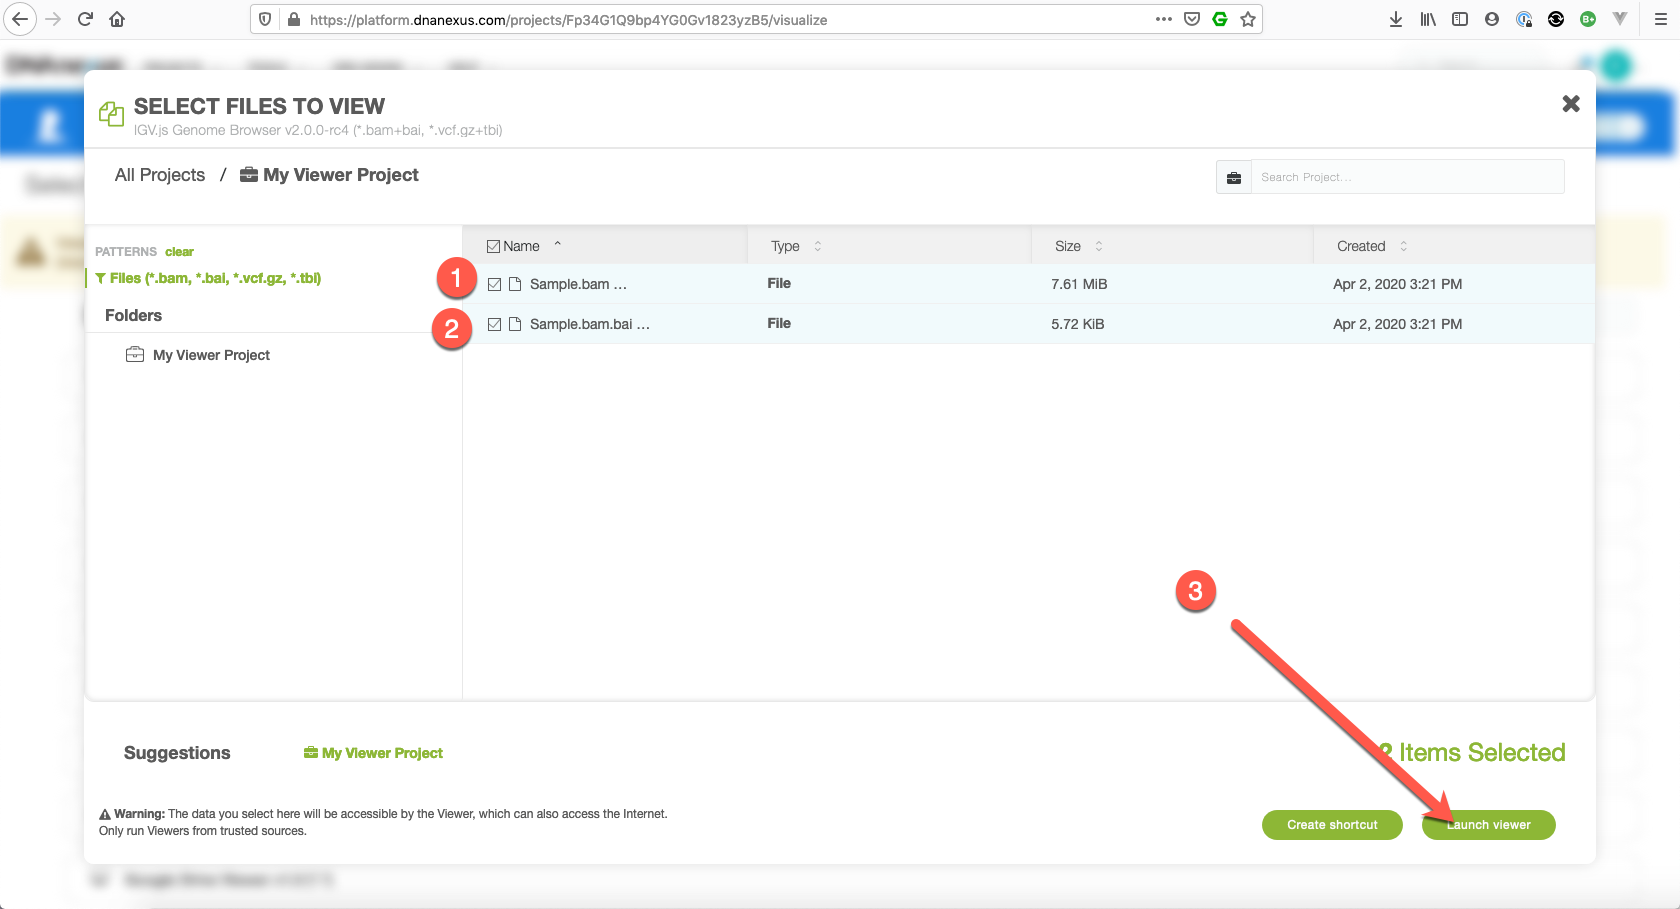
Select the files you want to view
Interactive Nodes in the Cloud
Apart from creating and running cloud apps, you can request an interactive node in the cloud to use for iterative development. This can be particularly useful if you want to run some quick analyses on the cloud, want to run tools without creating an app, or want to submit jobs similar to bsub on the local St. Jude HPC.
ChIP-Seq